Selecting and Viewing Reports and Statistics
From the Reports page, you can open various kinds of reports and statistics to view details.
[Menu Proxy — Headings — Online — Depth3 ]
Permission Required?
No special permission is required for this activity. All authors who are associated with the project are allowed.
How to Select and View Reports and Statistics
-
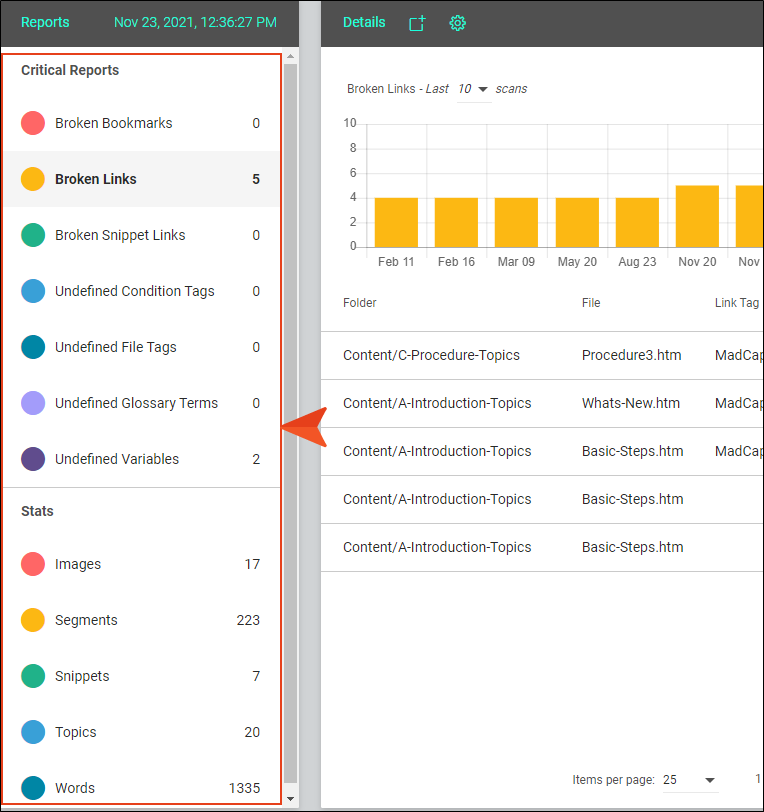
After opening the Reports page, notice the various types of reports and statistics on the left side of the page.

Critical Reports
The following reports are provided. These are all reports that are considered “critical,” in that your output will contain missing or incorrect information if you do not fix the issues.
- Broken Bookmarks These are links to bookmarks that are broken. In Flare, you need to fix the issue (e.g., remove or replace the bookmark link).
- Broken Links These are links—such as cross-references—that are broken. In Flare, you need to fix the issue (e.g., remove or replace the link).
-
Broken Snippet Links These are links to snippets that are broken. In Flare, you need to fix the issue (e.g., remove or replace the snippet).
-
Undefined Condition Tags These are conditions that have been applied in the project, but the name or location of those conditions cannot be found. This might occur, for example, if you have applied a condition in a topic and then later change the name of the tag or condition tag set. The old tag or set name is still used at the location where it was previously applied in the topic. In Flare, you need to fix the issue (e.g., rename the condition tag or set, remove the tag where it was applied).
- Undefined File Tags These are file tags that have been applied in the project, but the name or location of those file tags cannot be found. This might occur, for example, if you have associated a file tag with a topic and then later change the name of the tag or file tag set. The old tag or set name is still used for the topic. In Flare, you need to fix the issue (e.g., rename the file tag or set, remove the tag where it was applied).
- Undefined Glossary Term Links These are glossary term links in your content that are broken. This might occur, for example, if you have created a new term in a glossary and then inserted that term into a topic as a glossary term link. Later, you remove that term from the glossary. You now have a glossary term link in a topic, but the term no longer exists in the glossary. In Flare, you need to either remove the glossary term link from the content, or you need to add the term to the glossary again.
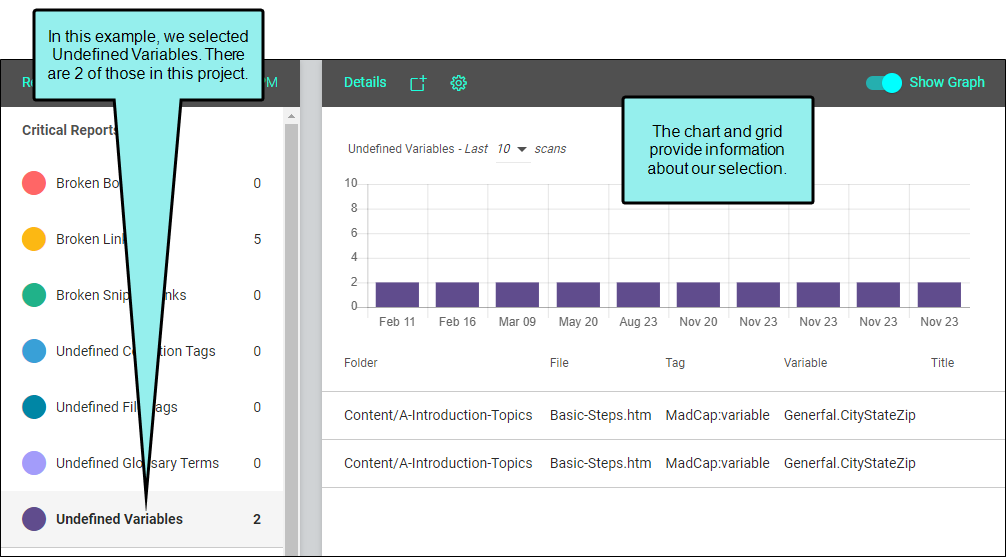
- Undefined Variables These are variables that have been inserted in the project, but the name or location of those variables cannot be found. This might occur, for example, if you have inserted a variable in a topic and then later change the name of the variable or variable set. The old variable or set name is still used at the location where it was previously inserted in the topic. In Flare, you need to fix the issue (e.g., rename the variable or set, remove the variable where it was applied).
Stats
In addition, you can view statistics (i.e., the count) for the following in each project:
- Images
- Segments (i.e., phrases or sentences)
- Snippets
- Topics
- Words
-
To see data for a particular report or statistical category, click it. The area to the right is then populated with a chart and grid.
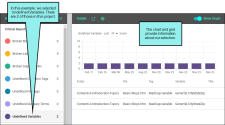
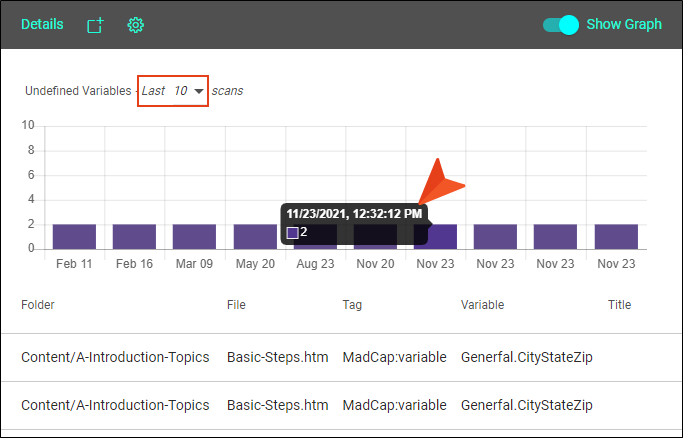
The chart shows a count history of the item, with each bar representing a different push of changes to Central. You might see many bars with the same date, because you might have pushed changes to Central multiple times throughout the day.
A drop-down lets you choose how many of the most recent scans to show in the chart (e.g., 1, 10, or 25). If you hover over a bar, the date, time, and count shows for a particular scan of the selected item.

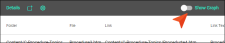
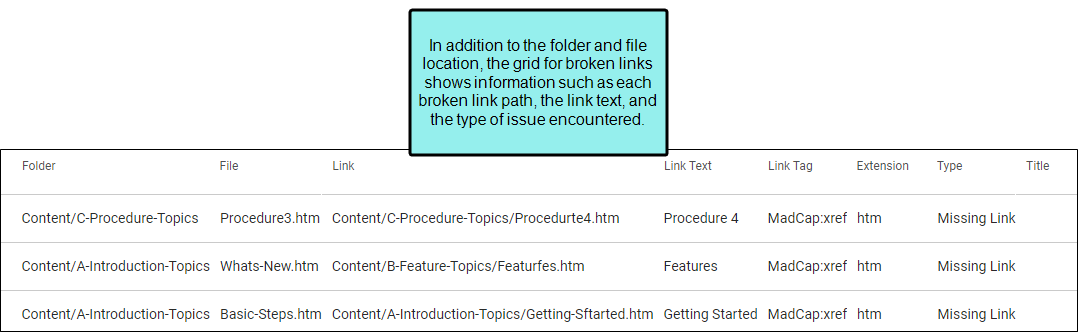
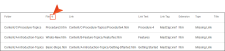
Unlike the chart, the grid below it does not show a history of pushes. Instead, it shows results for the most recent scan and displays all of the instances of the selected item in the project. For example, if you selected the Broken Links report, each row of the grid will show a broken link that was found in the latest scan of the project. The Folder and File columns on the left tell you where the issue was found. The rest of the columns are different for each type of report and provide information to track down the problem.
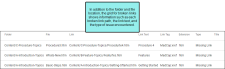
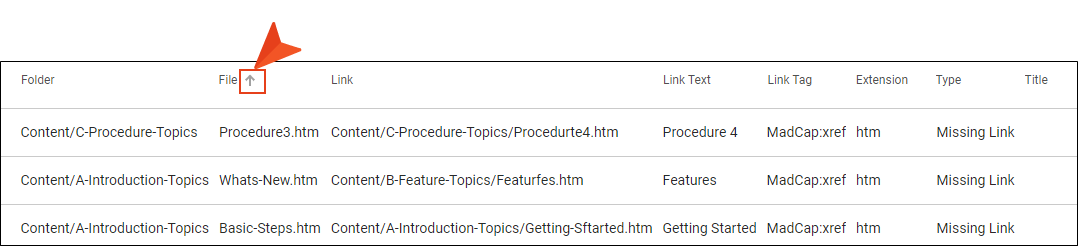
Hover to the right of any column heading for an arrow to display. Click the arrow to sort the information according to that column.
When you select a statistical category, the grid will show a count history for all of the categories. However, the chart above represents the count history for only the selected item.
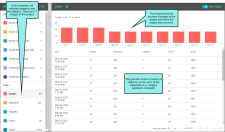
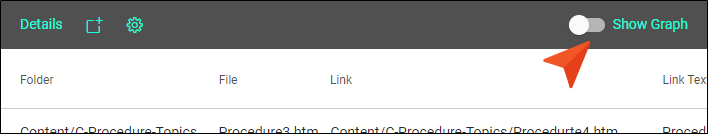
Note The chart and grid show by default for a particular report. You can hide the visual display of the chart by clicking the Show Charts option.